Hack the textbook figures
Every single figure in the text book Statistics, Data Mining, and Machine Learning in Astronomy is downloadable and fully reproducible online. Jake VanderPlas accomplished this heroic feat as a graduate student at the University of Washington. Jake recalled the origin story to some of us at the hack week. He explained that he would usually have the figure done the same week it was conceived, and was really pretty happy with the whole experience of being a part of making the textbook and ultimately becoming a coauthor. His figures are now indispensable. Because of Jake's investment, generations of astronomers to come can now benefit from reproducing the explanatory material in the Textbook. The figures are complementary to the textbook prose. The textbook prose explains the theoretical framework underlying the concepts. Equations are derived. But by digging into the textbook figure Python code, the reader can see how the method is implemented, and try it out by tweaking the input. "What happens if I double the noise? Or decimate the number of data points? Or change this-or-that parameter? How long does it take to run?"
These and other questions motivated my hack idea, which was to dig into the source code of textbook figures and do some hacking.
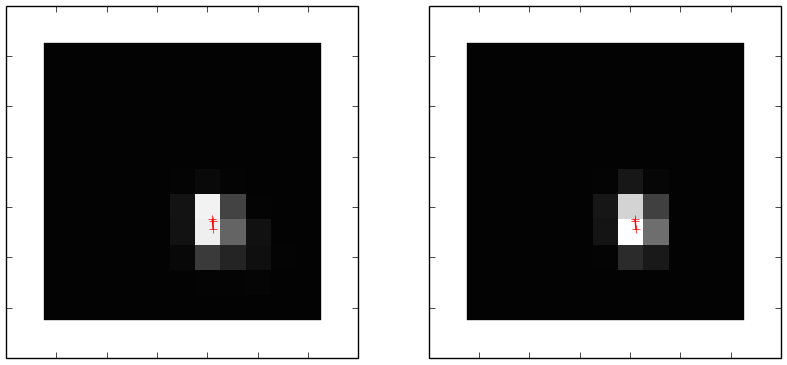
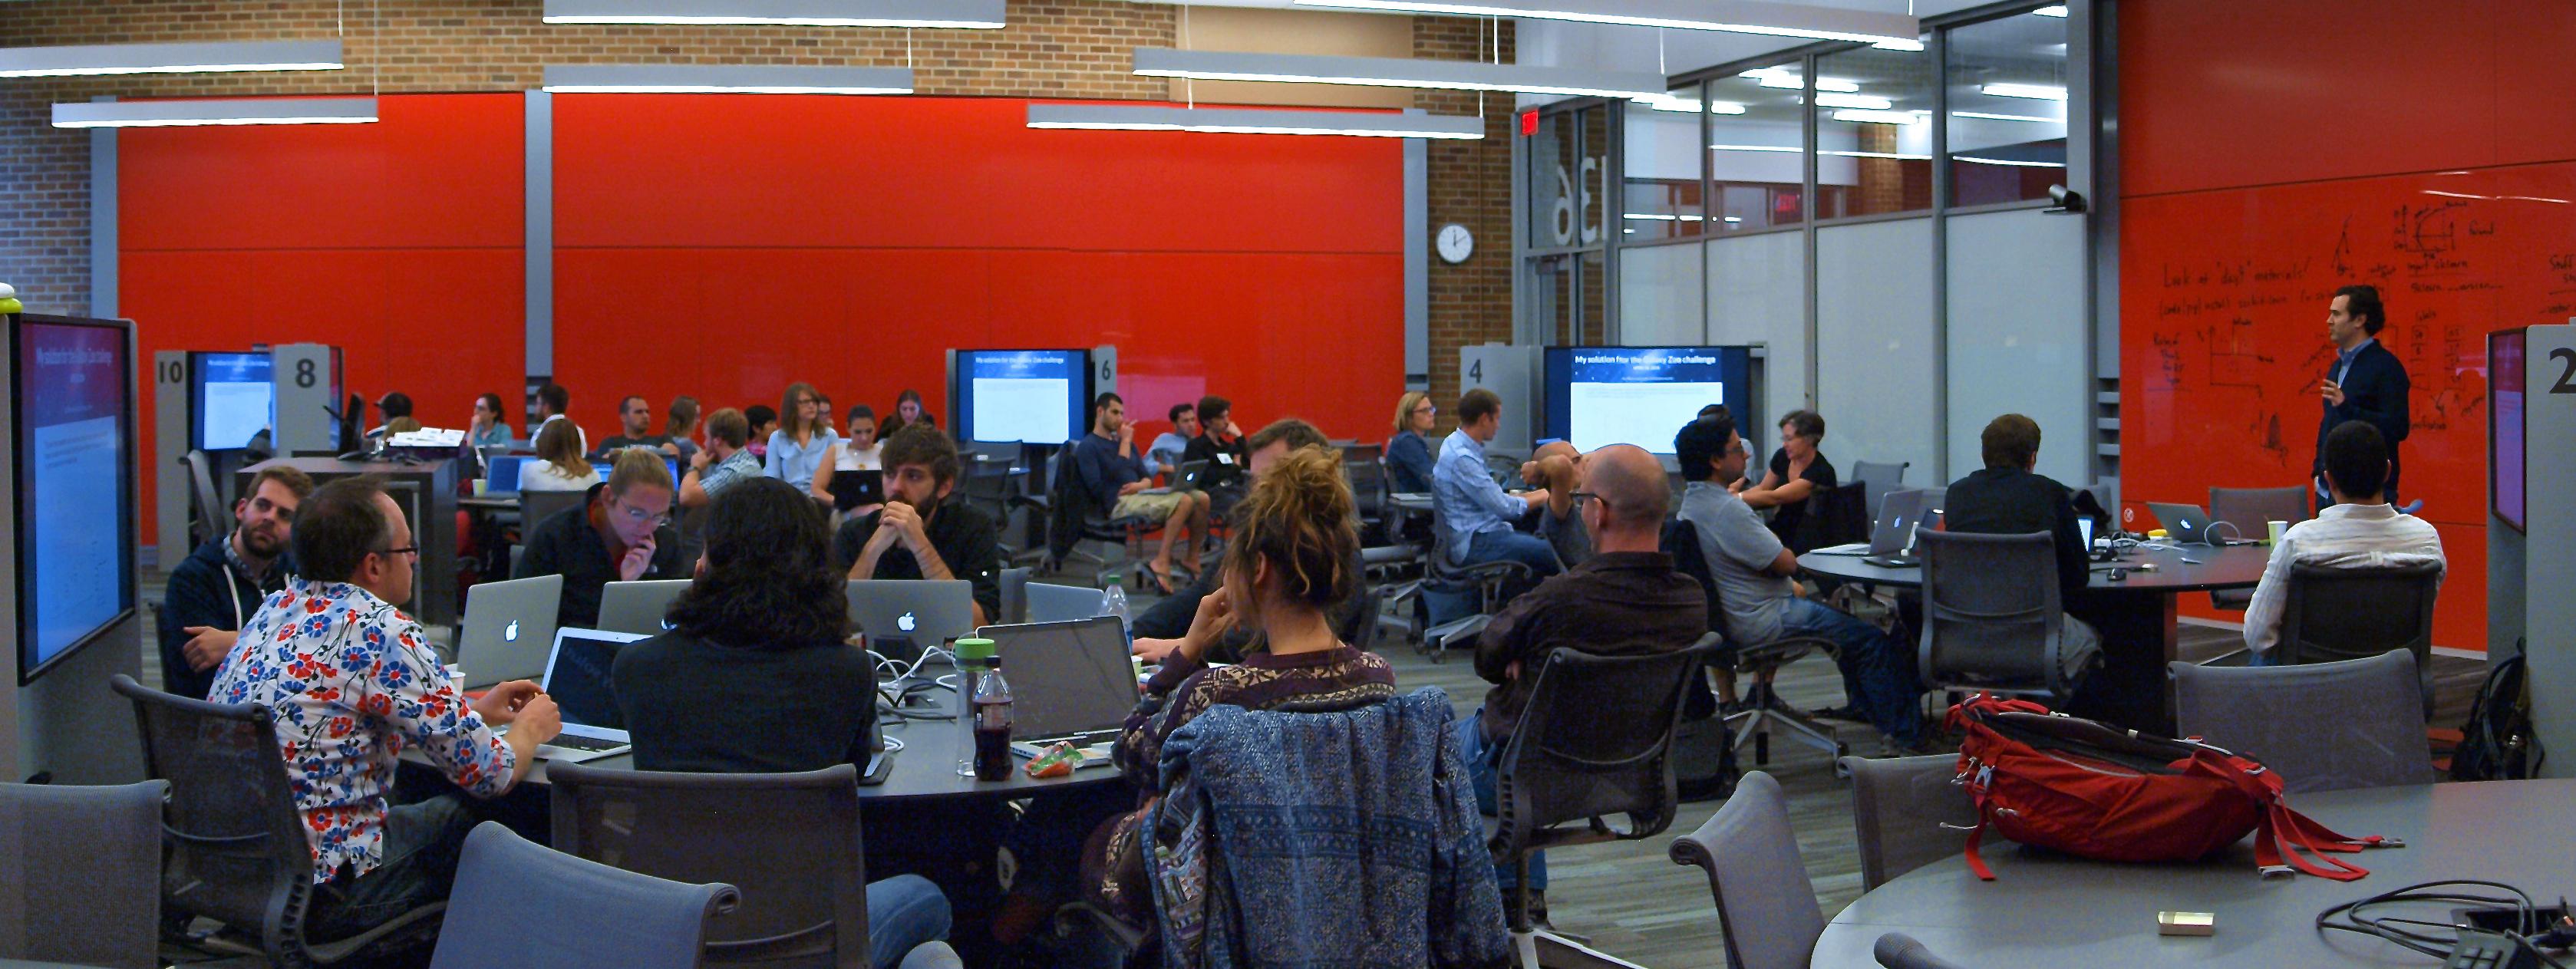
So on Wednesday of the Hack Week a table of about 8 of us all hacked the book figures. The figure above is one of those figures,


